We use cookies, including cookies from third parties, to enhance your user experience and the effectiveness of our marketing activities. These cookies are performance, analytics and advertising cookies, please see our Privacy and Cookie policy for further information. If you agree to all of our cookies select “Accept all” or select “Cookie Settings” to see which cookies we use and choose which ones you would like to accept.
Stock information
Our stock information includes various quotes, chart analyses, and foreign holdings for current and potential investors.
Stock quotes
Issued stocks
Capital stock
| Item | Number of issued stocks | Amount (in thousands of KRW) | Ratio (%) |
|---|---|---|---|
| Common stock | 163,647,814 | 818,239,070 | 90.5 |
| Preferred stock | 17,185,992 | 85,929,960 | 9.5 |
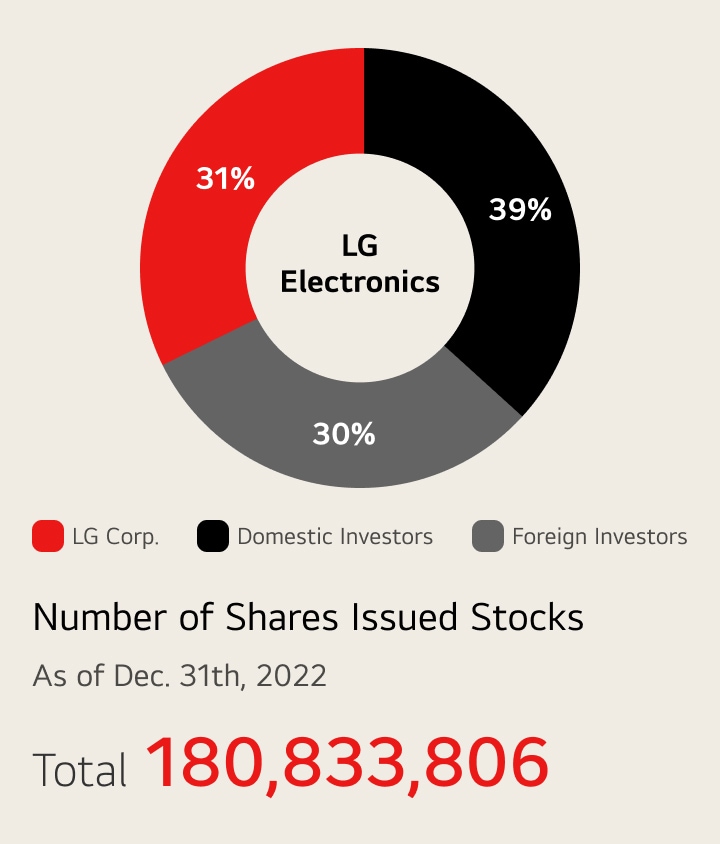
| Total | 180,833,806 | 904,169,030 | 100 |
Changes in capital stock
| Date | Content | Type | Quantity (shares) | Face value per share (in KRW) | Issued value per share (in KRW) | Capital after changes (in thousands of KRW) |
|---|---|---|---|---|---|---|
| 2011.12.29 | Rights offering | Common stock | 190,000 | 5,000 | 51,600 | 818,239,070 |
| Preferred stock | - | - | - | 85,929,960 | ||
| 2006.02.03 | Overseas CB | Common stock | 187,657 | 5,000 | 68,900 | 723,239,070 |
| Conversion | Preferred stock | - | - | - | 85,929,960 | |
| 2006.02.02 | Overseas CB | Common stock | 438,049 | 5,000 | 68,900 | 722,300,785 |
| Conversion | Preferred stock | - | - | - | 85,929,960 | |
| 2006.01.26 | Overseas CB | Common stock | 637,346 | 5,000 | 68,900 | 720,110,540 |
| Conversion | Preferred stock | - | - | - | 85,929,960 |
| 2022 | 2021 | 2020 | |
|---|---|---|---|
| LG Corp. | 31% | 31% | 31% |
| Foreign investors | 28% | 30% | 38% |
| Domestic investors | 41% | 39% | 31% |
The above percentages are based on data collected at the year-end
Dividends
We determine dividends based on profit, current year cash flow, and strategic future investments.
In line with our mid-to-long term dividend policy from January 2022, we plan to return more than 20% of the consolidated net profit of controlled shares to shareholders for three years (FY2021 to FY2023), excluding one-off non-recurring profit.
Details of dividend per share and total dividends according to the relevant fiscal year will be resolved by our board of directors and at annual general meetings, and we'll continue to make efforts to improve corporate and shareholder value, by maintaining stable dividend propensity.
※ Dividend per share in 2022: Common stock 700 Korean Won, Preferred stock 750 Korean Won
| 2022 (21th) | 2021 (20th) | 2020 (19th) | 2019 (18th) | 2018 (17th) | 2017 (16th) | 2016 (15th) | 2015 (14th) | 2014 (13th) | 2013 (12th) | ||
|---|---|---|---|---|---|---|---|---|---|---|---|
| Face value per share (KRW) | Common | 5,000 | 5,000 | 5,000 | 5,000 | 5,000 | 5,000 | 5,000 | 5,000 | 5,000 | 5,000 |
| Preferred | 5,000 | 5,000 | 5,000 | 5,000 | 5,000 | 5,000 | 5,000 | 5,000 | 5,000 | 5,000 | |
| Cash dividend per share (KRW) | Common | 700 | 850 | 1,200 | 750 | 750 | 400 | 400 | 400 | 400 | 200 |
| Preferred | 750 | 900 | 1,250 | 800 | 800 | 450 | 450 | 450 | 450 | 250 | |
(Consolidated) Net income (KRW billion) | 1,196.4 | 10,317 | 19,683 | 313 | 12,401 | 17,258 | 769 | 1,244 | 3,994 | 1,768 | |
Total cash dividends (KRW billion) | 126.9 | 1,539 | 2,169 | 1,359 | 1,359 | 729 | 729 | 729 | 729 | 369 | |
(Consolidated) Cash dividends payout ratio (%) | 10.6 | 14.9 | 11.0 | 434.4 | 11.0 | 4.2 | 94.8 | 58.6 | 18.3 | 20.9 | |
Cash dividend yield (%) | Common | 0.8 | 0.6 | 1.1 | 1.0 | 1.2 | 0.4 | 0.8 | 0.8 | 0.7 | 0.3 |
| Preferred | 1.7 | 1.4 | 2.5 | 2.8 | 3.1 | 1.0 | 1.9 | 1.6 | 1.6 | 1.0 |
