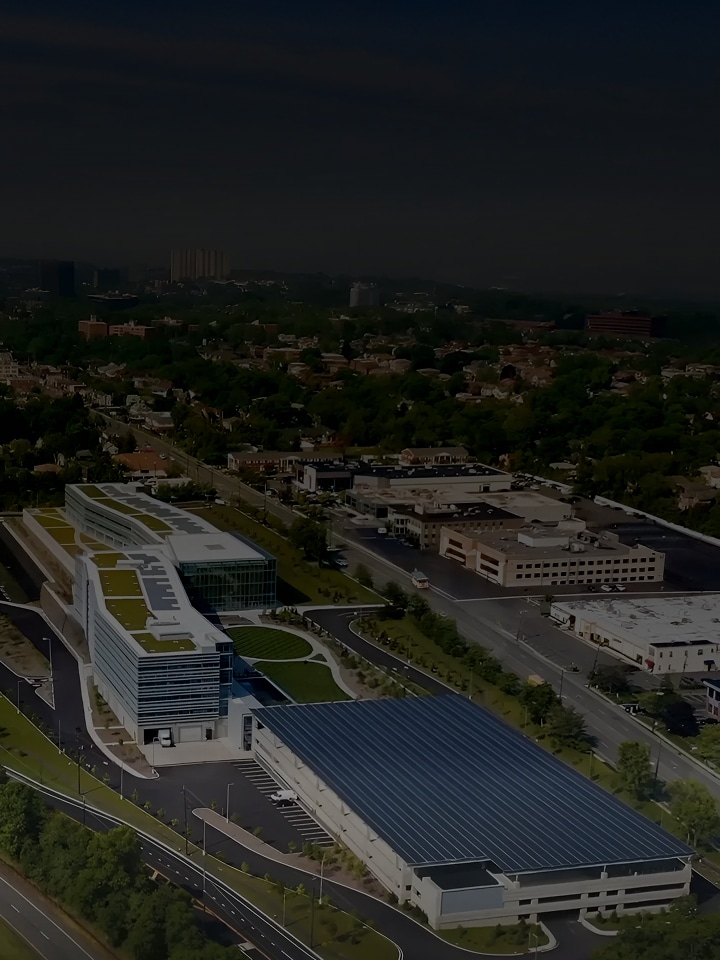
An aerial view of LG Electronics’ eco-conscious headquarters in the United States, showing multiple buildings with rooftop solar panels surrounded by greenery and roads, representing carbon neutrality and the transition to renewable energy

From reduction to neutrality

Our choices today shape the environment of tomorrow. LG Electronics aims to achieve carbon neutrality by 2030 by transforming its business operation model and presenting a sustainable direction for future business through a full transition to 100% renewable energy.

LG Electronics is planning to accomplish carbon neutrality by using renewable energy.

Scope 1, 2

Achieve a 54.6% greenhouse gases reduction by 2030 compared to 2017 base year.(Based on SBTi)

By 2030, LG Electronics plans to reduce greenhouse gas emissions through production process improvements, the adoption of energy-saving technologies, and the use of renewable energy, while achieving carbon neutrality through external GHG reduction projects.

A chart showing 53% in 2024, 56% in 2025, and a 100% carbon neutrality target for 2030.

Scope 3

Achieve a 20% greenhouse gases reduction per functional unit across key product lines - TVs, monitors, refrigerators, washing machines, dryers and air conditioners(residential and system) by 2030 compared to 2020 base year.(Based on SBTi)

LG Electronics is actively reducing greenhouse gas emissions during the product use phase by developing high-efficiency products, supported by detailed energy efficiency targets and action plans for each product line.

This chart compares performance and targets for carbon emission reduction during the product use phase. The reduction rate increased from 19.4% in 2024 to 22.5% in 2025, with a target of achieving a 20.0% reduction by 2030.

RE 100

Achieving 100% Renewables by 2050.

Carbon neutral strategy

  • Energy efficiency icon

    30% improvement in energy efficiency

    Introduction of high-efficiency energy facilities

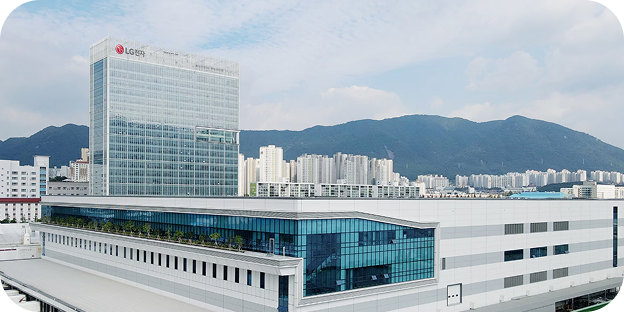
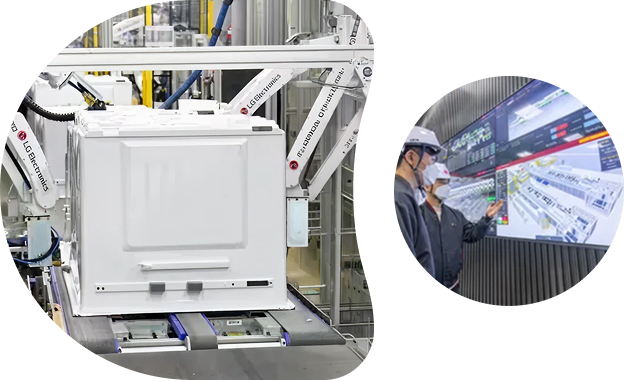
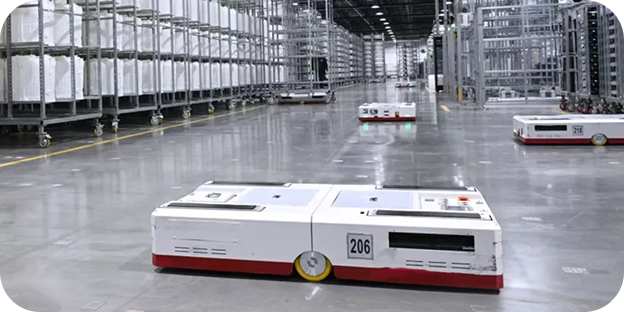
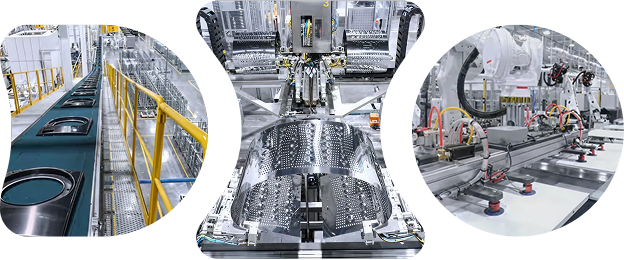
    LG Smart Park in Changwon, selected as a WEF "Lighthouse Factory," has improved energy efficiency by 30% compared to conventional factories through advanced solutions such as ESS (Energy Storage System) and BECON (Building Energy Control).*

  • Waste refrigerant recycle icon

    100% recovery and purification of waste refrigerant

    Investment in refrigerant recovery facilities (Changwon plant)

    By introducing a recovery and purification system for waste refrigerants, we're recovering waste refrigerant, equal to 50,000 tCO₂e every year, which were emitted into the atmosphere. Waste refrigerants are generated from air-conditioner compressors with defects and malfunctions.

  • CO₂ emissions reduction icon

    GHG emissions reduction in product life cycle

    Development and expansion of energy-efficient products

    We promote environmental improvements through product lightweighting, resource conservation, and enhanced energy efficiency. In addition, we reduce carbon emissions during the product usage stage by developing and selling energy-efficient products, and we further expand the launch of products equipped with high-efficiency energy technologies.

    Establishment of strategic energy management systems

    Based on the Technology Road Map (TRM), we establish and implement detailed energy efficiency goals and action plans for each product. We also comply with global energy regulations, including Energy-related Products (ErP), while setting internal energy-related targets and developing detailed implementation strategies.

Lighthouse Factory

Lighting the path toward sustainability

A Lighthouse Factory is a top-tier model of global smart manufacturing selected by the World Economic Forum (WEF) since 2018. As its name suggests, it serves as a "lighthouse" for the manufacturing sector, guiding other companies toward pathways of innovation.

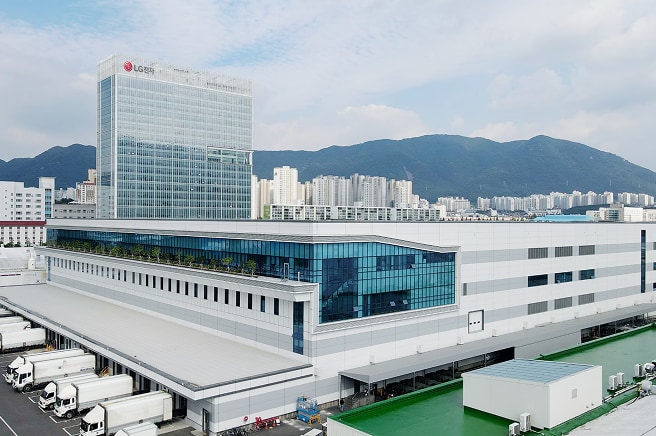
  • An exterior view of the LG Electronics Changwon Smart Park factory complex with mountains and a cityscape in the background
    Changwon | Republic of Korea

    LG Electronics Smart Park: The first Lighthouse Factory in the home appliance industry

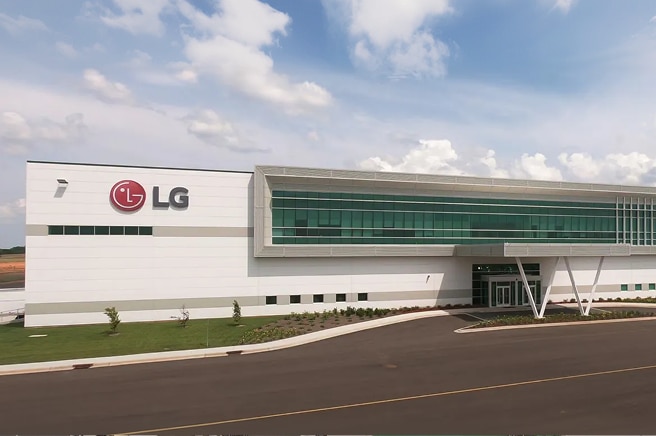
  • Modern exterior of the LG Electronics factory in Tennessee
    Tennessee | United States

    LG Electronics Tennessee Plant: The first Lighthouse Factory in the U.S. home appliance industry

Renewable energy

LG Electronics has established and is implementing a mid- to long-term plan to achieve 100% renewable energy usage. LG Electronics is reviewing and applying the most eligible implementation options considering regional conditions, including participation in green pricing programs, the purchasing EAC (Energy Attribute Certificate), and PPA (Power Purchase Agreements).

Transition to 100% renewable energy by 2050 (RE100)

  • Establishment of a mid- to long-term plan to achieve the transition to 100% renewable energy
  • Expansion of renewable energy transition, considering local laws and site conditions in the countries where LG manufacturing sites of LG Electronics are located
  • Reviewing applicable options such as PPAs, the purchasing EACs (Energy Attribute Certificates), and green pricing programs for renewable energy procurement

Global renewable energy expansion performance and plan

  • Roadmap for achieving RE100

    A mixed chart showing LG Electronics' annual renewable energy transition roadmap toward RE100. Renewable energy (GWh) increases from 231 GWh in 2025 to 290 GWh in 2026, 376 GWh in 2027, 445 GWh in 2028, 565 GWh in 2029, 826 GWh in 2030, 1,450 GWh in 2040, and 1,976 GWh in 2050. The renewable energy transition rate targets rise from 17.7% in 2025 to 24% in 2026, 30% in 2027, 35% in 2028, 43% in 2029, 62% in 2030, 90% in 2040, and 100% by 2050.

  • PPA (Power Purchase Agreements)

    A line chart showing LG Electronics' annual PPA (Power Purchase Agreement) performance (unit: GWh). 38 GWh in 2022, 56 GWh in 2023, 104 GWh in 2024, and 171 GWh in 2025.

Renewable energy implementation status

A world map showing locations where renewable energy implementation information can be accessed, with markers placed on the USA, Brazil, Poland, Türkiye, Thailand, China, and Korea.

Global

  • In progress RE100
  • Achieved RE100
Explore our achievements
  • Changwon Smart Park1

    Utilized 2.3 MW of renewable electricity through Korea's 1st off-grid PPA and 3.2MW of solar power through on site PPA.

  • Changwon Smart Park2

    Implement 2 MW of solar power through on-site PPA

  • Pyeongtaek Digital Park

    Introduced 1.4 MW of solar power generation

  • Tianjin

    Implement 14 MW of solar power through on-site PPA

  • Taizhou

    Implement 10.58 MW of solar power through on-site PPA

  • Nanjing

    Implemented 6.7 MW of solar power through on-site PPA

  • Huizhou

    Implemented 3.2 MW of solar power through off-site PPA

  • Achieved RE100

    Clarksville (Tennessee)

    Purchased renewable energy certificates for 100% of electricity consumption

  • Achieved RE100

    Huntsville (Alabama)

    Purchased renewable energy certificates for 100% of electricity consumption

  • Achieved RE100

    Manaus

    Transitioned to 100% renewable energy (Hydropower) through off-site PPA

  • Achieved RE100

    Mlawa

    Transition to 100% renewable energy through off-site PPA

  • Achieved RE100

    Istanbul

    Purchased renewable energy certificates for 100% of electricity consumption

  • Rayong

    Implement 7.4 MW of solar power through PPA

* As of 2025

Global greenhouse gas management

LG Electronics transparently measures and systematically manages greenhouse gas (GHG) emissions, integrating them with financial value to achieve its carbon neutrality goals.

  • Measurement, reporting, and verification of GHG emissions

    LG Electronics established a GHG inventory encompassing global production sites and the entire value chain (Scope 1, 2, and 3), and transparently discloses GHG emissions annually.

  • Energy management systems

    LG Electronics maintains ISO 50001 certification for all production sites and operates the Corporate Carbon Management System (CCMS) to monitor global energy use monthly.

  • Carbon accounting and internal carbon pricing

    LG Electronics tracks carbon allowances and actual emissions quarterly, applies internal carbon pricing to evaluate risks and opportunities, and supports investment decisions for GHG reduction.

Global GHG emissions

Scope 1 & 2

LG Electronics' greenhouse gas emissions (Scope 1 & 2) from 2023 to 2025 — includes information on Category, Detailed Criteria, Regional Classification, Unit, and figures for 2023, 2024, and 2025.
Category Detailed Criteria Region Unit 2023 2024 2025
Direct GHC emissions (Scope 1) - Korea tCO₂eq 74,773 77,452 75,462
Overseas 134,174 147,811 131,613
Total 208,947 225,263 207,075
Indirect GHC emissions (Scope 2) Location-based Korea 218,586 225,984 222,881
Overseas 491,841 535,808 542,714
Total 710,427 761,792 764,995
Market-based Korea 217,159 225,984 222,281
Overseas 448,125 455,329 412,172
Total 665,284 681,313 634,453
Total GHG emissions (Scope 1 + Scope 2) Location-based Korea
+ Overseas
919,374 987,055 972,070
Market-based 874,231 906,576 841,528
GHG emissions (Scope 1 + Scope 2) target Market-based 923,000 919,600 901,754
GHG emissions intensity (per unit) Market-based tCO₂eq /
KRW 100 million
1.06 1.03 0.94

Scope 31)

LG Electronics' greenhouse gas emissions (Scope 3) from 2023 to 2025 — includes information on Category, Unit, and figures for 2023, 2024, and 2025. Detailed status of LG Electronics' Scope 3 GHG emissions by 15 categories from 2023 to 2025 (unit: tCO2eq). Includes materiality and coverage information for key emission sources, such as purchased goods and services and the use of sold products.
Category Unit 2023 2024 2025
Category Materiality1) Unit 2023 2024 2025
Category 1 Purchased goods and services H tCO₂eq 2,712,121 2,468,350 2,254,187
Category 2 Capital goods L 400,997 287,860 245,524
Category 3 Fuel/Energy-related Activities L 135,070 151,474 147,547
Category 42) Upstream transportation and distribution H 826,753 1,363,300 1,625,445
Category 5 Waste generated in operations L 12,769 10,588 12,761
Category 6 Business travel L 46,073 78,307 62,744
Category 7 Employee commuting L 78,055 82,500 75,310
Category 8 Upstream leased assets L 65,377 90,795 99,396
Category 93) Downstream transportation and distribution H Not applicable Not applicable Not applicable
Category 10 Processing of sold products L 37,810 39,239 37,445
Category 11 Use of sold products L 61,207,842 65,061,927 64,070,256
Category 12 End-of-life treatment of sold products H 1,153,377 1,220,204 1,227,391
Category 13 Downstream leased assets L 3,005 3,005 1,021
Category 14 Franchises L Not applicable Not applicable Not applicable
Category 15 Investments H 2,482,319 1,902,052 1,758,556
Total GHG emissions (Scope 3) tCO₂eq 69,161,568 72,759,601 71,617,583

1) Categories with less than 1% contribution to total GHG emissions are marked as L (Low), and those with 1% or more as H (High)

2) Both the stage where suppliers deliver components to LG Electronics and the downstream distribution stage to end customers are included

3) In accordance with the GHG Protocol, emissions from the distribution stage of LG Electronics’ finished products are included in and calculated under Category 4.

1) Detailed emissions by category within Scope 3 are described on page 23, 'Climate Change Response (TCFD).'

* LG Electronics calculates and discloses all 15 Scope 3 categories​​

Last updated July 13, 2026

Explore more

An image featuring a three-dimensional arrangement of rocks, plants, and objects against a light green background. Green leaves extend around a large, rough-textured gray rock in the center, with a transparent circular glass plate and a small oval-shaped object resting on top.

Home

Sustainability

Learn more
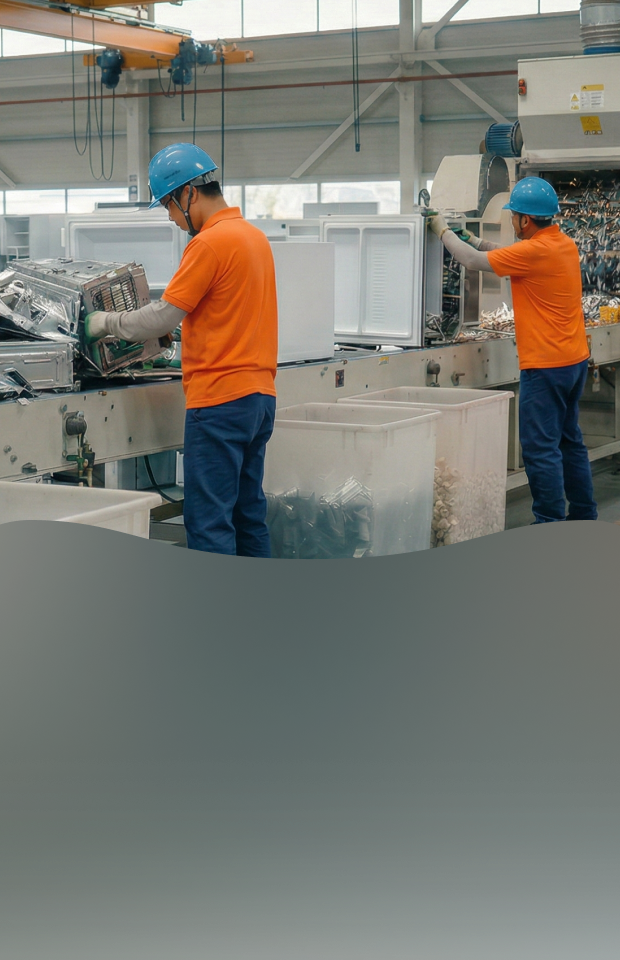
Workers wearing orange t-shirts and blue safety helmets standing at a conveyor belt line in a factory, sorting electronic waste parts and carrying out the recycling process.

For the planet

Circularity

Learn more
A panoramic view of a two-story house illuminated under the night sky. An outdoor air conditioning unit is installed on the terrace, and various home appliances such as a refrigerator, washing machine, and dryer are visible inside the house through large glass windows.

For the planet

Clean technology

Learn more